uv init shelter_usage
cd shelter_usageOnline Appendix B — Python essentials
Prerequisites
Key concepts and skills
Software and packages
Python(Python Software Foundation 2024)datetime>=5.5uvpolars
B.1 Introduction
Python is a general-purpose programming language created by Guido van Rossum. Python version 0.9.0 was released in February 1991, and the current version, 3.13, was released in October 2024. It was named Python after Monty Python’s Flying Circus.
Python is a popular language in machine learning, but it was designed, and is more commonly used, for more general software applications. This means that we will especially rely on packages when we use Python for data science. This use of Python in this book is focused on data science, rather than the other, more general, uses for which it was developed.
Knowing R will allow you to pick up Python for data science quickly. The main data science packages share the need to solve the same underlying problems.
B.2 Python, VS Code, and uv
We could use Python within RStudio, but another option is to use what is used by the community more broadly, which is VS Code. You can download VS Code for free here and then install it. If you have difficulties with this, then in the same way we started with Posit Cloud and the shifted to our local machine, you could initially use Google Colab here.
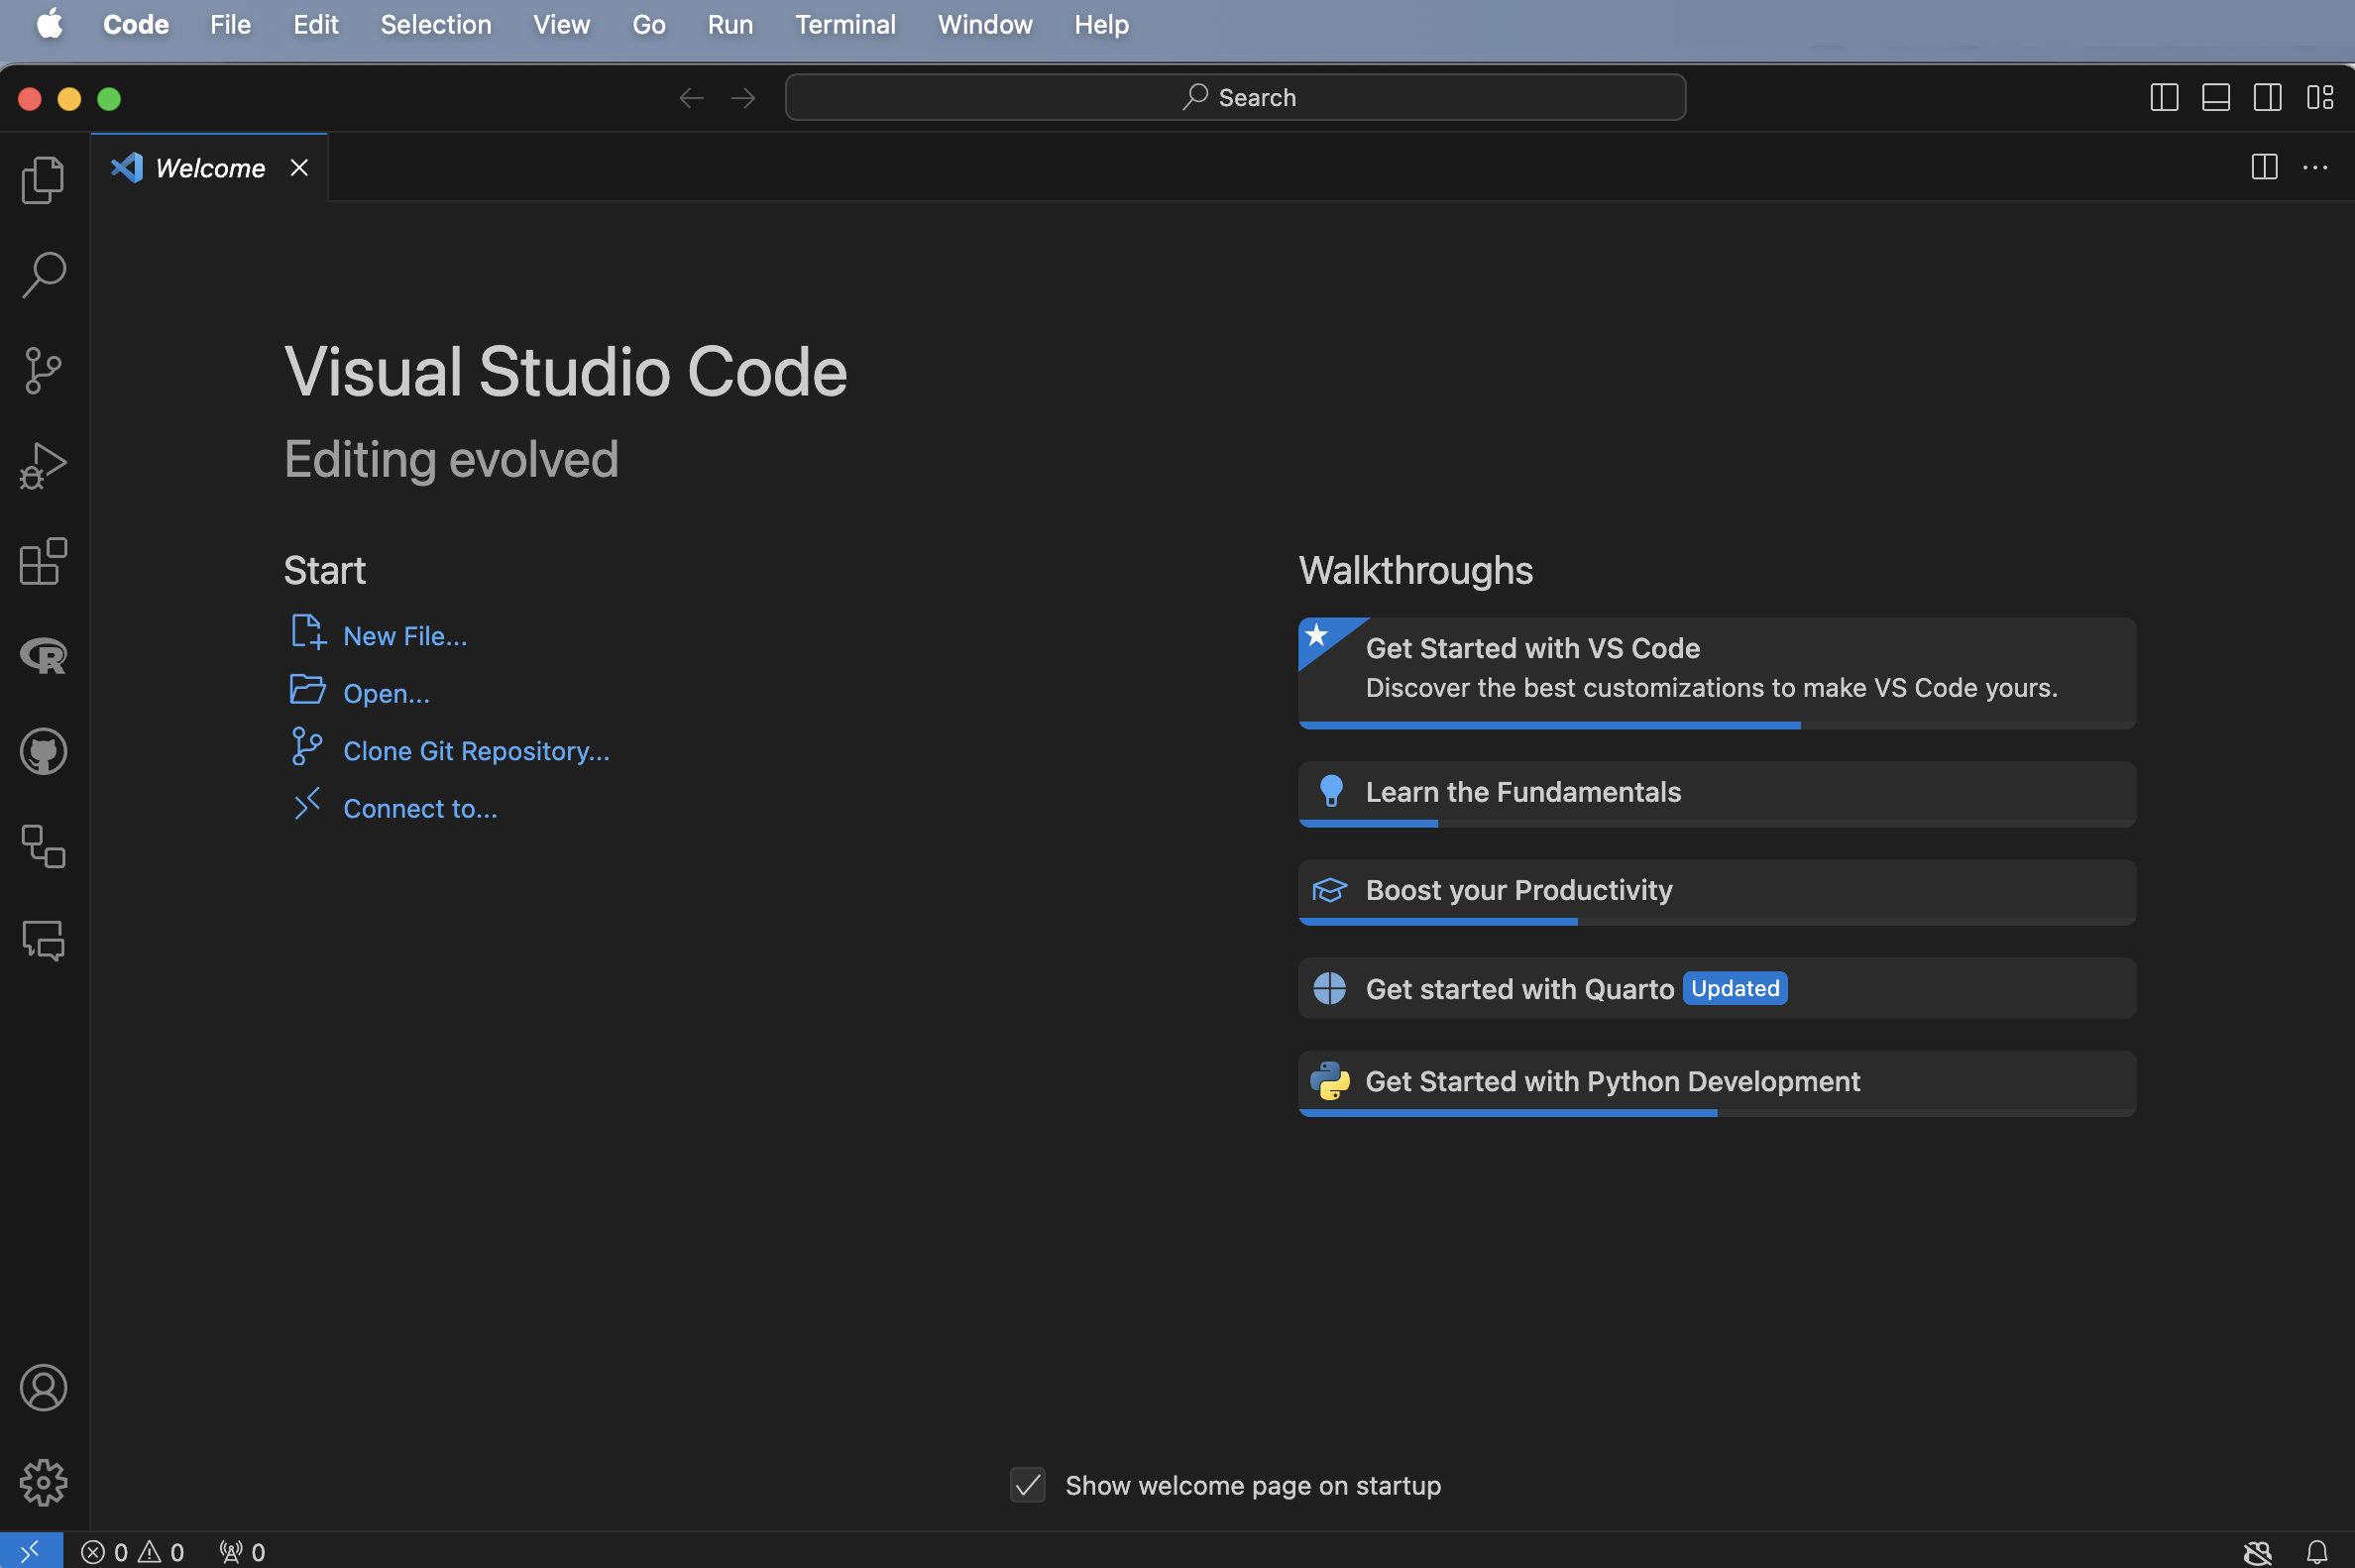
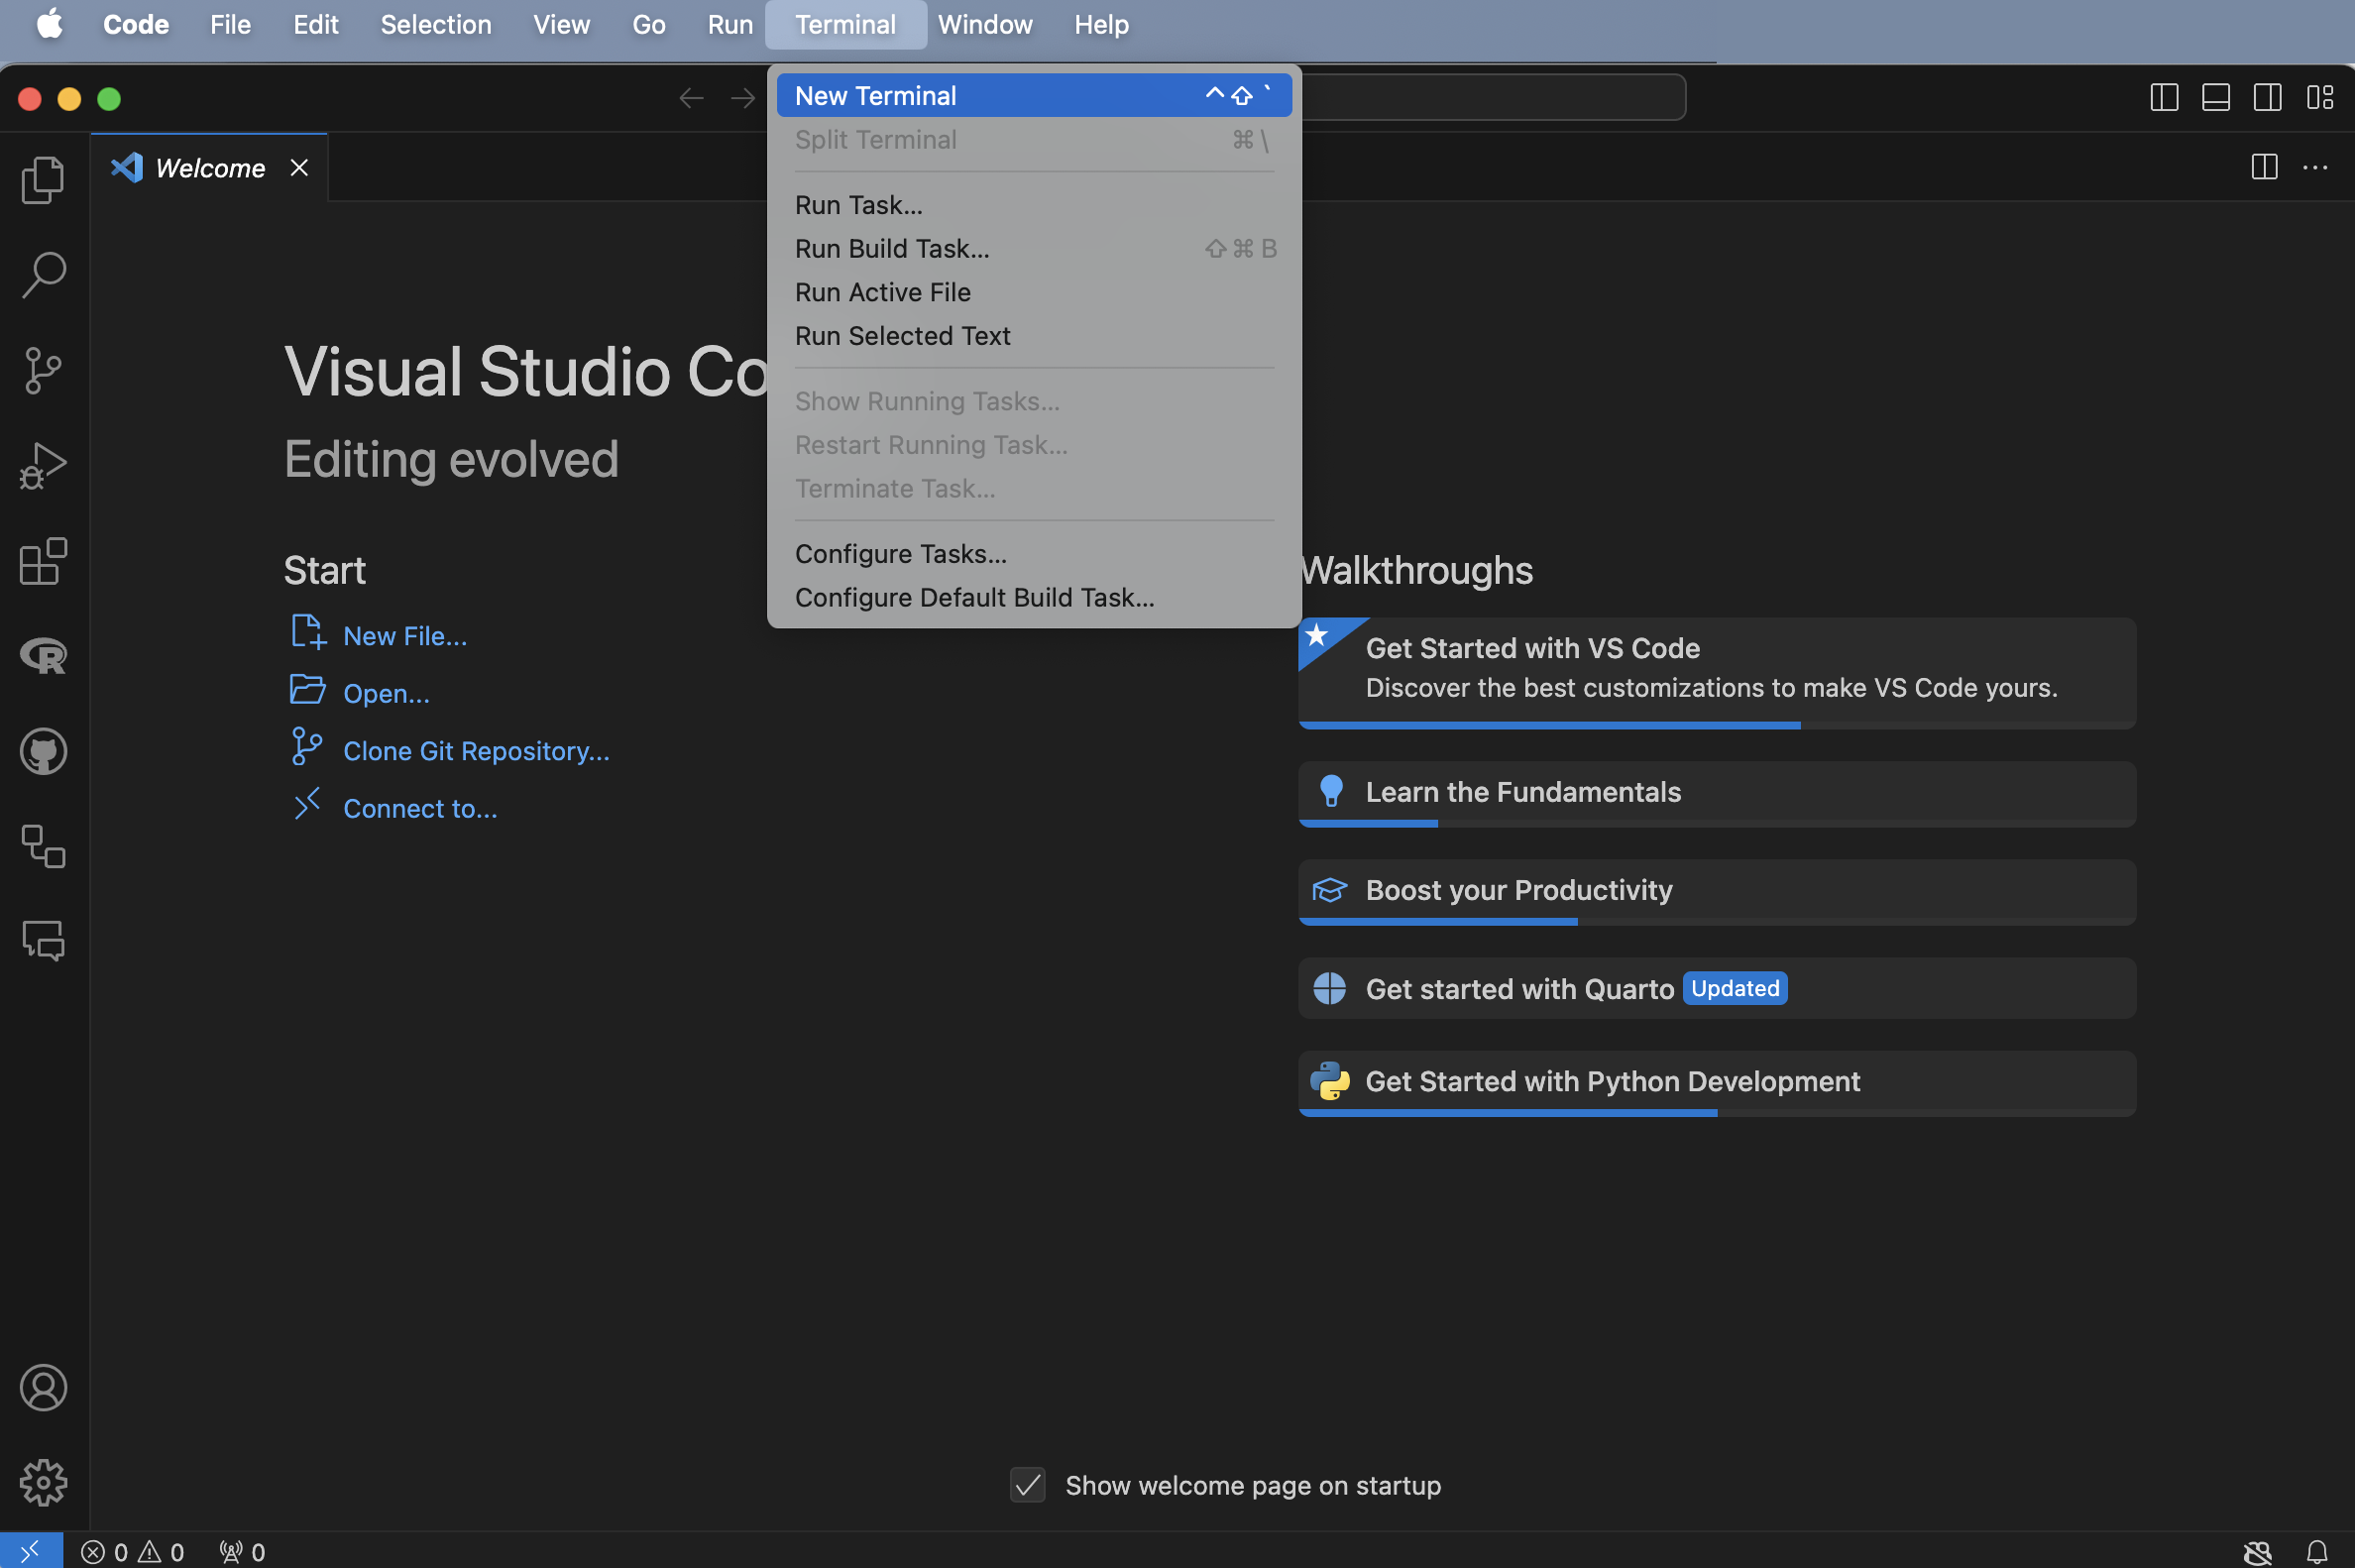
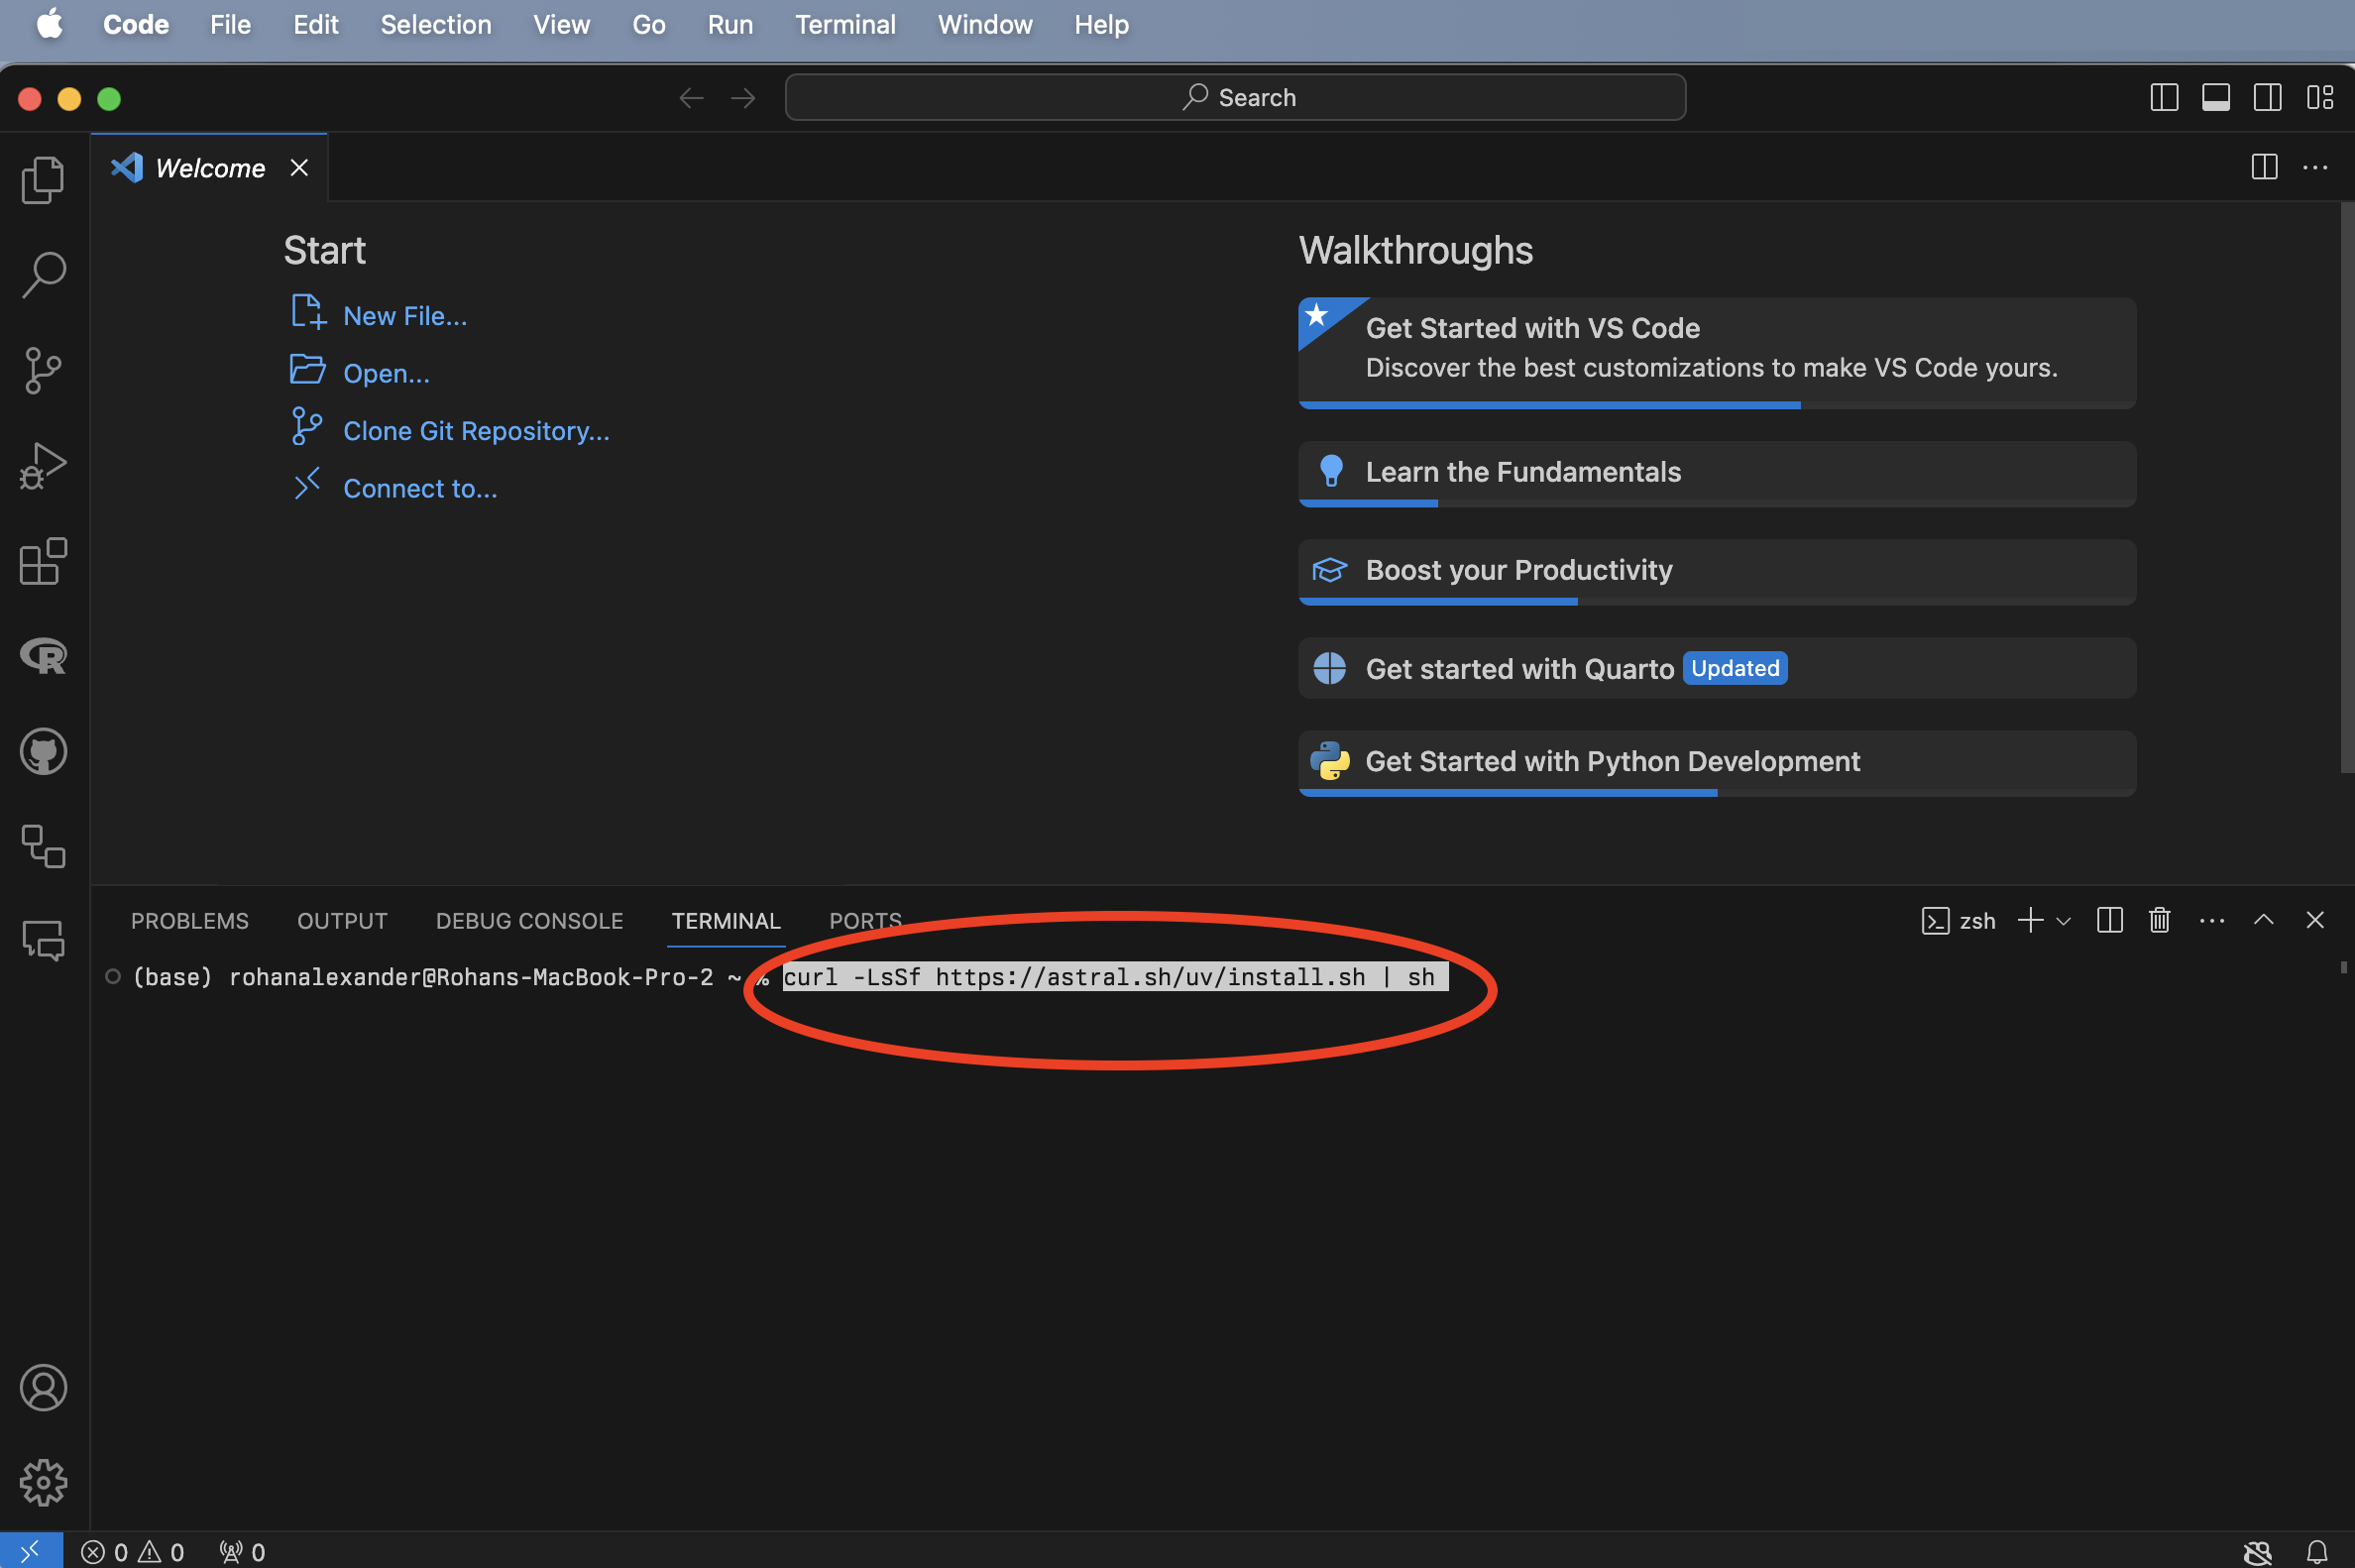
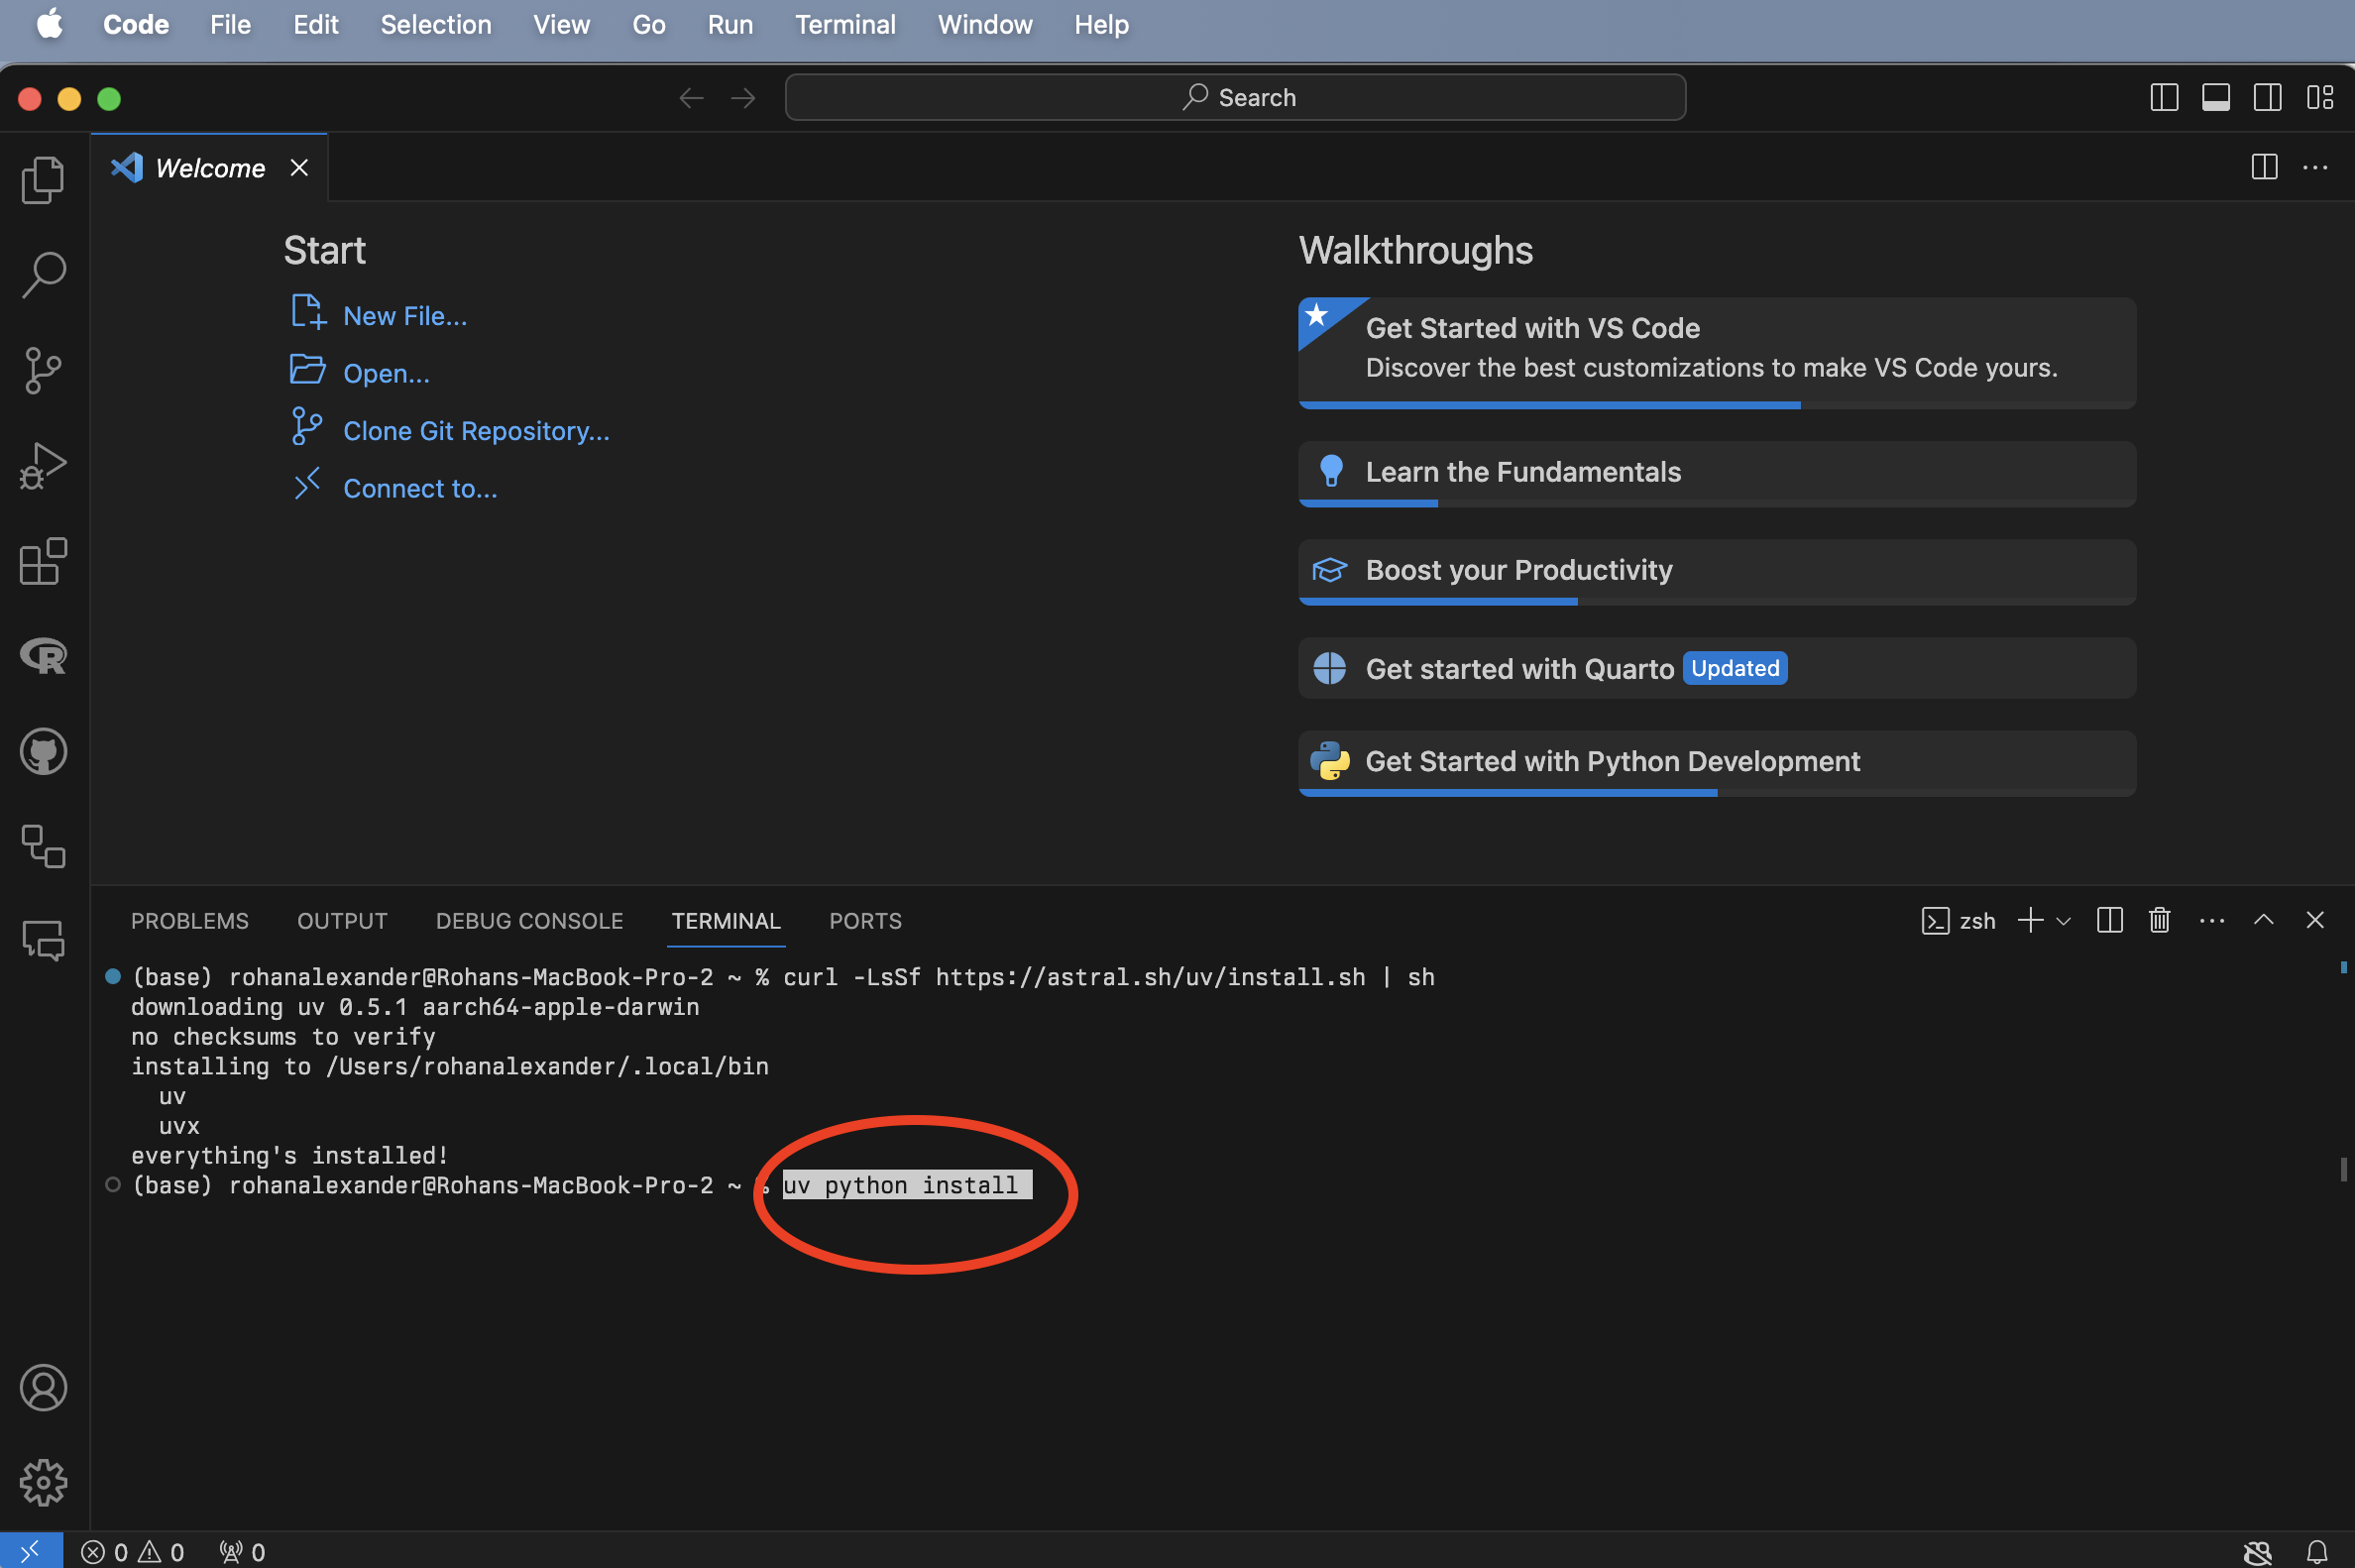
Open VS Code (Figure B.1 (a)), and open a new Terminal: Terminal -> New Terminal (Figure B.1 (b)). We can then install uv, which is a Python package manager, by putting curl -LsSf https://astral.sh/uv/install.sh | sh into the Terminal and pressing “return/enter” afterwards (Figure B.1 (c)). Finally, to install Python we can use uv by putting uv python install into that Terminal and pressing “return/enter” afterwards (Figure B.1 (d)).
B.3 Getting started
B.3.1 Project set-up
We are going to get started with an example that downloads some data from Open Data Toronto. To start, we need to create a project, which will allow all our code to be self-contained.
Open VS Code and open a new Terminal: “Terminal” -> “New Terminal”. Then use Unix shell commands to navigate to where you want to create your folder. For instance, use ls to list all the folders in the current directory, then move to one using cd and then the name of the folder. If you need to go back one level then use ...
Once you are happy with where you are going to create this new folder, we can use uv init in the Terminal to do this, pressing “return/enter” afterwards (cd then moves to the new folder “shelter_usage”).
By default, there will be a script in the example folder. We want to use uv run to run that script, which will then create an project environment for us.
uv run hello.pyA project environment is specific to that project. We will use the package numpy to simulate data. We need to add this package to our environment with uv add.
uv add numpyWe can then modify hello.py to use numpy to simulate from the Normal distribution.
import numpy as np

def main():
    np.random.seed(853)

    mu, sigma = 0, 1
    sample_sizes = [10, 100, 1000, 10000]
    differences = []

    for size in sample_sizes:
        sample = np.random.normal(mu, sigma, size)
        sample_mean = np.mean(sample)
        diff = abs(mu - sample_mean)
        differences.append(diff)
        print(f"Sample size: {size}")
        print(f"  Difference between sample and population mean: {round(diff, 3)}")

if __name__ == "__main__":
    main()
After we have modified and saved hello.py we can run it with uv run in exactly the same way as before.
At this point we should close VS Code. We want to re-open it to make sure that our project environment is working as it needs to. In VS Code, a project is a self-contained folder. You can open a folder with “File” -> “Open Folder…” and then select the relevant folder, in this case “shelter_usage”. You should then be able to re-run uv run hello.py and it should work.
B.3.2 Plan
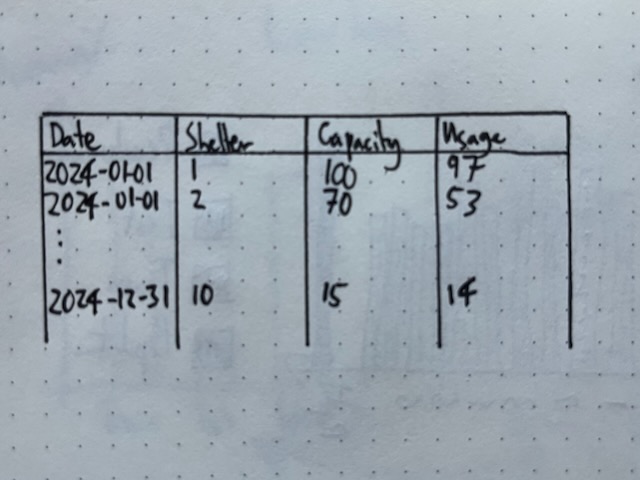
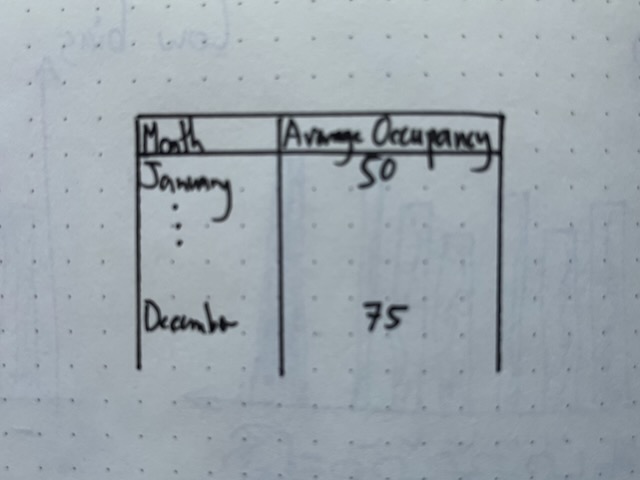
We first used this dataset in Chapter 2, but as a reminder, for each day, for each shelter, there is a number of people that used the shelter. So the dataset that we want to simulate is something like Figure B.2 (a) and we are wanting to create a table of average daily number of occupied beds each month, along the lines of Figure B.2 (b).
B.3.3 Simulate
We would like to more thoroughly simulate the dataset that we are interested in. We will use polars to provide a dataframe to store our simulated results, so we should add this to our environment with uv add.
uv add polarsCreate a new Python file called 00-simulate_data.py.
#### Preamble ####
# Purpose: Simulates a dataset of daily shelter usage
# Author: Rohan Alexander
# Date: 12 November 2024
# Contact: rohan.alexander@utoronto.ca
# License: MIT
# Pre-requisites:
# - Add `polars`: uv add polars
# - Add `numpy`: uv add numpy
# - Add `datetime`: uv add datetime


#### Workspace setup ####
import polars as pl
import numpy as np
from datetime import date

rng = np.random.default_rng(seed=853)


#### Simulate data ####
# Simulate 10 shelters and some set capacity
shelters_df = pl.DataFrame(
    {
        "Shelters": [f"Shelter {i}" for i in range(1, 11)],
        "Capacity": rng.integers(low=10, high=100, size=10),
    }
)

# Create data frame of dates
dates = pl.date_range(
    start=date(2024, 1, 1), end=date(2024, 12, 31), interval="1d", eager=True
).alias("Dates")

# Convert dates into a data frame
dates_df = pl.DataFrame(dates)

# Combine dates and shelters
data = dates_df.join(shelters_df, how="cross")

# Add usage as a Poisson draw
poisson_draw = rng.poisson(lam=data["Capacity"])
usage = np.minimum(poisson_draw, data["Capacity"])

data = data.with_columns([pl.Series("Usage", usage)])

data.write_parquet("simulated_data.parquet")
We would like to write tests based on this simulated data that we will then apply to our real data. We use pydantic to do this and so we should add this to our environment with uv add.
uv add pydanticCreate a new Python file called 00-test_simulated_data.py. The first step is to define a subclass `ShelterData of BaseModel which comes from pydantic.
from pydantic import BaseModel, Field, ValidationError, field_validator
from datetime import date

# Define the Pydantic model
class ShelterData(BaseModel):
    Dates: date  # Validates date format (e.g., 'YYYY-MM-DD')
    Shelters: str  # Must be a string
    Capacity: int = Field(..., ge=0)  # Must be a non-negative integer
    Usage: int = Field(..., ge=0)  # Must be non-negative

    # Add a field validator for usage to ensure it does not exceed capacity
    @field_validator("Usage")
    def check_usage_not_exceed_capacity(cls, usage, info):
        capacity = info.data.get("Capacity")
        if capacity is not None and usage > capacity:
            raise ValueError(f"Usage ({usage}) exceeds capacity ({capacity}).")
        return usage
We are interested in testing that dates are valid, shelters have the correct type, and that capacity and usage are both non-negative integers. One additional wrinkle is that usage should not exceed capacity. To write a test for that we use a field_validator.
We can then import our simulated dataset and test it.
import polars as pl

df = pl.read_parquet("simulated_data.parquet")

# Convert Polars DataFrame to a list of dictionaries for validation
data_dicts = df.to_dicts()

# Validate the dataset in batches
validated_data = []
errors = []

# Batch validation
for i, row in enumerate(data_dicts):
    try:
        validated_row = ShelterData(**row)  # Validate each row
        validated_data.append(validated_row)
    except ValidationError as e:
        errors.append((i, e))

# Convert validated data back to a Polars DataFrame
validated_df = pl.DataFrame([row.dict() for row in validated_data])

# Display results
print("Validated Rows:")
print(validated_df)

if errors:
    print("\nErrors:")
    for i, error in errors:
        print(f"Row {i}: {error}")
To see what would have happened if there were an error we can consider a smaller dataset that contains two errors: one poorly formatted date and one situation where usage is above capacity.
import polars as pl
from pydantic import BaseModel, Field, ValidationError, field_validator
from datetime import date

# Define the Pydantic model
class ShelterData(BaseModel):
    Dates: date  # Validates date format (e.g., 'YYYY-MM-DD')
    Shelters: str  # Must be a string
    Capacity: int = Field(..., ge=0)  # Must be a non-negative integer
    Usage: int = Field(..., ge=0)  # Must be non-negative

    # Add a field validator for Usage to ensure it does not exceed Capacity
    @field_validator("Usage")
    def check_usage_not_exceed_capacity(cls, usage, info):
        capacity = info.data.get("Capacity")
        if capacity is not None and usage > capacity:
            raise ValueError(f"Usage ({usage}) cannot exceed Capacity ({capacity}).")
        return usage

# Define the dataset
df = [
    {"Dates": "2024-01-01", "Shelters": "Shelter 1", "Capacity": 23, "Usage": 22},
    {"Dates": "rohan", "Shelters": "Shelter 2", "Capacity": 62, "Usage": 62},
    {"Dates": "2024-01-01", "Shelters": "Shelter 3", "Capacity": 93, "Usage": 88},
    # Add invalid row for testing
    {"Dates": "2024-01-01", "Shelters": "Shelter 4", "Capacity": 50, "Usage": 55},
]

# Validate the dataset in batches
validated_data = []
errors = []

# Batch validation
for i, row in enumerate(df):
    try:
        validated_row = ShelterData(**row)  # Validate each row
        validated_data.append(validated_row)
    except ValidationError as e:
        errors.append((i, e))

# Convert validated data back to a Polars DataFrame
validated_df = pl.DataFrame([row.dict() for row in validated_data])

# Display results
print("Validated Rows:")
print(validated_df)

if errors:
    print("\nErrors:")
    for i, error in errors:
        print(f"Row {i}: {error}")
We get the following message:
Errors:
Row 1: 1 validation error for ShelterData
Dates
  Input should be a valid date or datetime, input is too short [type=date_from_datetime_parsing, input_value='rohan', input_type=str]
    For further information visit https://errors.pydantic.dev/2.9/v/date_from_datetime_parsing
Row 3: 1 validation error for ShelterData
Usage
  Value error, Usage (55) cannot exceed Capacity (50). [type=value_error, input_value=55, input_type=int]
    For further information visit https://errors.pydantic.dev/2.9/v/value_error
B.3.4 Acquire
Using the same source as before: https://open.toronto.ca/dataset/daily-shelter-overnight-service-occupancy-capacity/
import polars as pl

# URL of the CSV file
url = "https://ckan0.cf.opendata.inter.prod-toronto.ca/dataset/21c83b32-d5a8-4106-a54f-010dbe49f6f2/resource/ffd20867-6e3c-4074-8427-d63810edf231/download/Daily%20shelter%20overnight%20occupancy.csv"

# Read the CSV file into a Polars DataFrame
df = pl.read_csv(url)

# Save the raw data
df.write_parquet("shelter_usage.parquet")
We are likely only interested in a few columns and only rows where there are data.
import polars as pl

df = pl.read_parquet("shelter_usage.parquet")

# Select specific columns
selected_columns = ["OCCUPANCY_DATE", "SHELTER_ID", "OCCUPIED_BEDS", "CAPACITY_ACTUAL_BED"]

selected_df = df.select(selected_columns)

# Filter to only rows that have data
filtered_df = selected_df.filter(df["OCCUPIED_BEDS"].is_not_null())

print(filtered_df.head())

renamed_df = filtered_df.rename({"OCCUPANCY_DATE": "date",
                                 "SHELTER_ID": "Shelters",
                                 "CAPACITY_ACTUAL_BED": "Capacity",
                                 "OCCUPIED_BEDS": "Usage"
                                 })

print(renamed_df.head())

renamed_df.write_parquet("cleaned_shelter_usage.parquet")
We may then want to apply the tests to the real dataset
import polars as pl
from pydantic import BaseModel, Field, ValidationError, field_validator
from datetime import date

# Define the Pydantic model
class ShelterData(BaseModel):
    Dates: date  # Validates date format (e.g., 'YYYY-MM-DD')
    Shelters: str  # Must be a string
    Capacity: int = Field(..., ge=0)  # Must be a non-negative integer
    Usage: int = Field(..., ge=0)  # Must be non-negative

    # Add a field validator for Usage to ensure it does not exceed Capacity
    @field_validator("Usage")
    def check_usage_not_exceed_capacity(cls, usage, info):
        capacity = info.data.get("Capacity")
        if capacity is not None and usage > capacity:
            raise ValueError(f"Usage ({usage}) cannot exceed Capacity ({capacity}).")
        return usage

df = pl.read_parquet("cleaned_shelter_usage.parquet")

# Convert Polars DataFrame to a list of dictionaries for validation
data_dicts = df.to_dicts()

# Validate the dataset in batches
validated_data = []
errors = []

# Batch validation
for i, row in enumerate(data_dicts):
    try:
        validated_row = ShelterData(**row)  # Validate each row
        validated_data.append(validated_row)
    except ValidationError as e:
        errors.append((i, e))

# Convert validated data back to a Polars DataFrame
validated_df = pl.DataFrame([row.dict() for row in validated_data])

# Display results
print("Validated Rows:")
print(validated_df)

if errors:
    print("\nErrors:")
    for i, error in errors:
        print(f"Row {i}: {error}")
B.3.5 Explore
Manipulate the data
import polars as pl

df = pl.read_parquet("cleaned_shelter_usage.parquet")

# Convert the date column to datetime and rename it for clarity
df = df.with_columns(pl.col("date").str.strptime(pl.Date, "%Y-%m-%d").alias("date"))

# Group by "Dates" and calculate total "Capacity" and "Usage"
aggregated_df = (
    df.group_by("date")
    .agg([
        pl.col("Capacity").sum().alias("Total_Capacity"),
        pl.col("Usage").sum().alias("Total_Usage")
    ])
    .sort("date")  # Sort the results by date
)

# Display the aggregated DataFrame
print(aggregated_df)
Make a graph
import polars as pl
import seaborn as sns
import matplotlib.pyplot as plt
import pandas as pd
import matplotlib.dates as mdates

# Read the Polars DataFrame from a Parquet file
df = pl.read_parquet("analysis_data.parquet")

# Ensure the 'date' column is of datetime type in Polars
df = df.with_columns([
    pl.col('date').cast(pl.Date)
])

# Select the relevant columns and reshape the DataFrame
df_melted = df.select(["date", "Total_Capacity", "Total_Usage"]).melt(
    id_vars="date",
    variable_name="Metric",
    value_name="Value"
)

# Convert Polars DataFrame to a Pandas DataFrame for Seaborn
df_melted_pd = df_melted.to_pandas()

# Ensure 'date' column is datetime in Pandas
df_melted_pd['date'] = pd.to_datetime(df_melted_pd['date'])

# Set the plotting style
sns.set_theme(style="whitegrid")

# Create the plot
plt.figure(figsize=(12, 6))
sns.lineplot(
    data=df_melted_pd,
    x="date",
    y="Value",
    hue="Metric",
    linewidth=2.5
)

# Format the x-axis to show dates nicely
plt.gca().xaxis.set_major_locator(mdates.AutoDateLocator())
plt.gca().xaxis.set_major_formatter(mdates.DateFormatter('%Y-%m-%d'))

# Rotate x-axis labels for better readability
plt.xticks(rotation=45)

# Add labels and title
plt.xlabel("Date")
plt.ylabel("Values")
plt.title("Total Capacity and Usage Over Time")

# Adjust layout to prevent clipping of tick-labels
plt.tight_layout()

# Display the plot
plt.show()B.4 Python
For loops
List comprehensions
B.5 Making graphs
matplotlib
seaborn
B.6 Exploring polars
B.6.1 Importing data
B.6.2 Dataset manipulation with joins and pivots
B.6.3 String manipulation
B.6.4 Factor variables
B.7 Exercises
Practice
Quiz
Task
Free Replit “100 Days of Code” Python course.